File ManagerAccount SettingsAccessing The SoftwareSupportTeam ManagementFull Demos
Certification
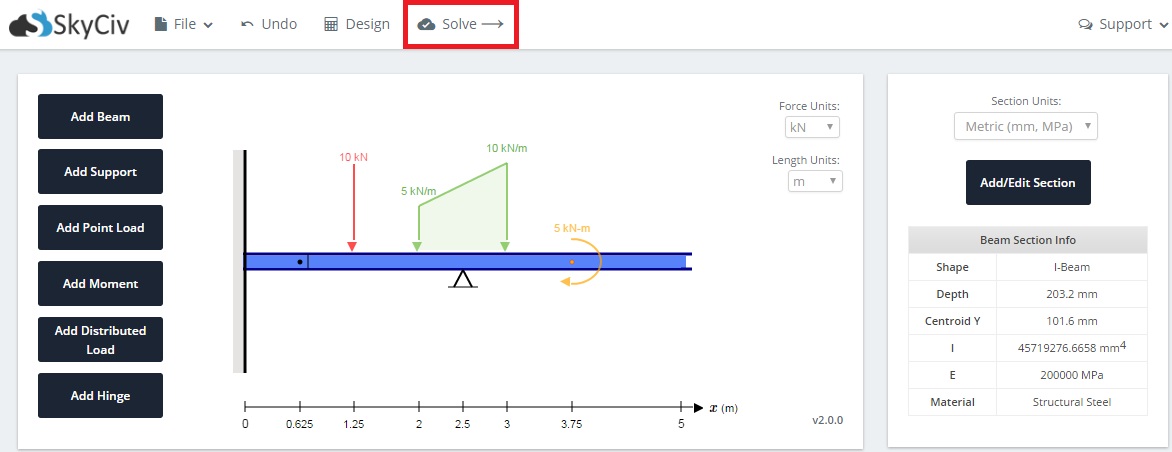
When you've finished building your model, you can solve for various results by clicking the 'Solve' button located a the top of your model. The model below continues the example from the previous sections.
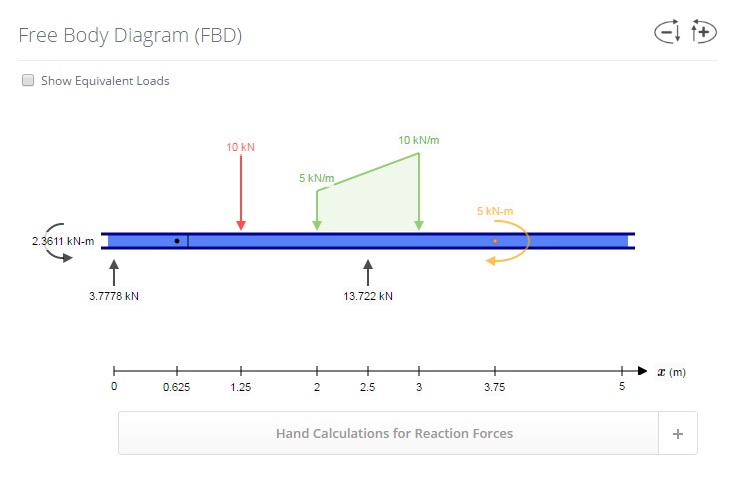
A free body diagram is available to view the reactions at the supports to the model. We also provide hand calculations to demonstrate how the reaction results were calculated in a step by step manner. More details about the Hand Caluclations are provided in its own section.
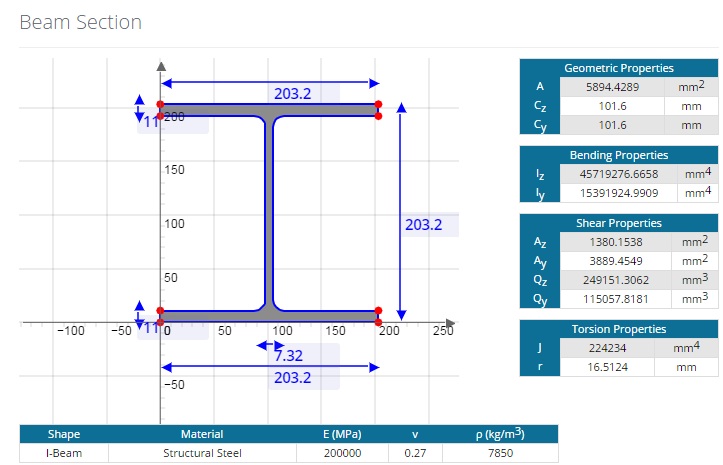
A summary of the section used for the beam is presented with the results.
The geometry of the beam together with its dimensions are displayed on the left.
To the right, tables are presented to display the geometric, bending, shear, and torsion properties.
At the bottom, the material properties are summarised in the table.
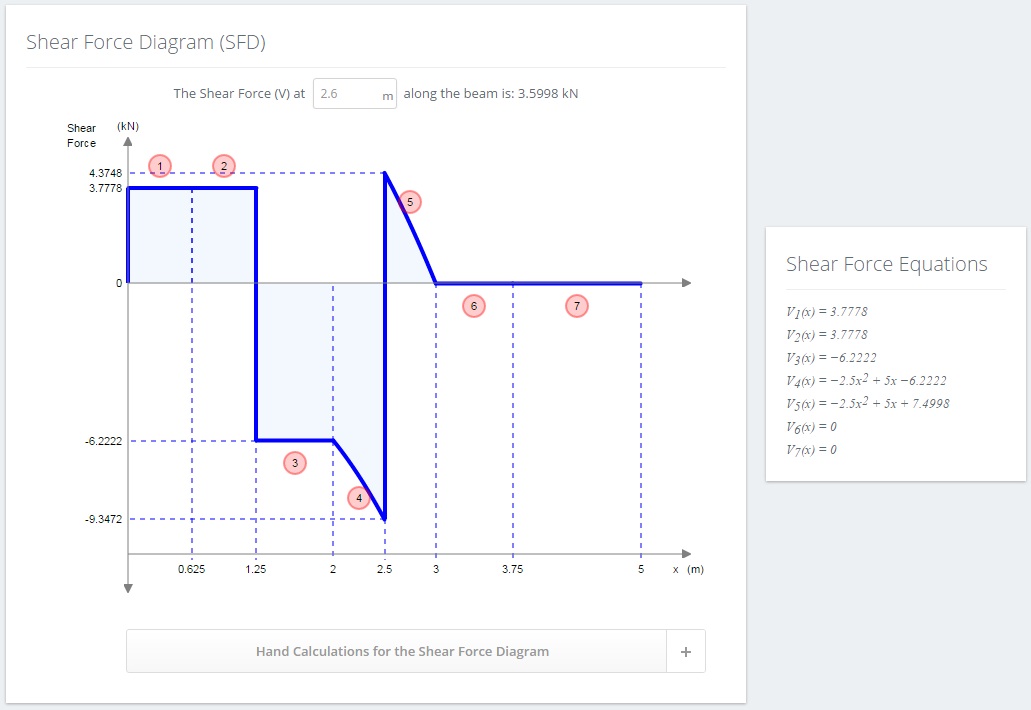
The Shear Force Diagram (SFD) of your model is presented with the results. As expected, it plots the shear force values against the length of the beam.
To the right of the SFD, the Shear Force Equations are presented at each discontinuity. Use the circled numbers above each section of the SFD line to match with the equation.
Above the SFD, an input box is available to enter in a specific position along the beam to determine the shear force at that point.
Hand calculations are also available for the SFD to demonstrate how the Shear Force Equations were derived. More details about the Hand Caluclations are provided in its own section.
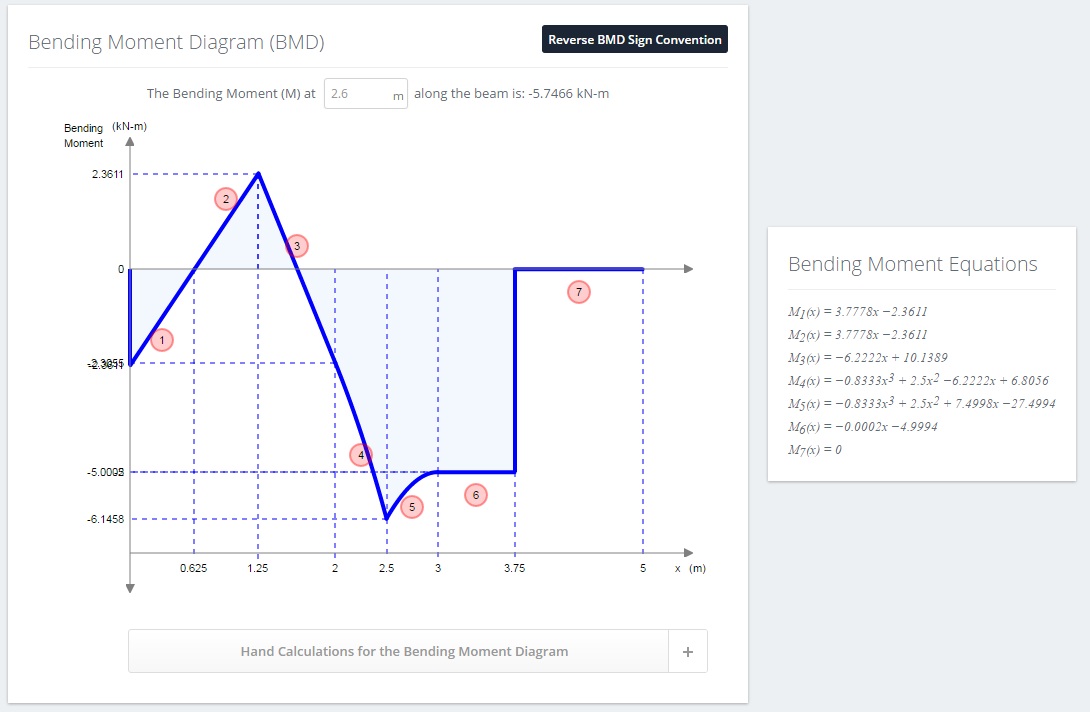
The Bending Moment Diagram (BMD) of your model is presented with the results. As expected, it plots the bending moment values against the length of the beam.
An option exists to reverse the BMD sign convention. This means that what was considered positive will now be considered negative and vice versa. Click the 'Reverse BMD Sign Convention' to toggle this option.
To the right of the BMD, the Bending Moment Equations are presented at each discontinuity. Use the circled numbers above each section of the BMD line to match with the equation.
Above the BMD, an input box is available to enter in a specific position along the beam to determine the bending moment at that point.
Hand calculations are also available for the BMD to demonstrate how the Bending Moment Equations were derived. More details about the Hand Caluclations are provided in its own section.
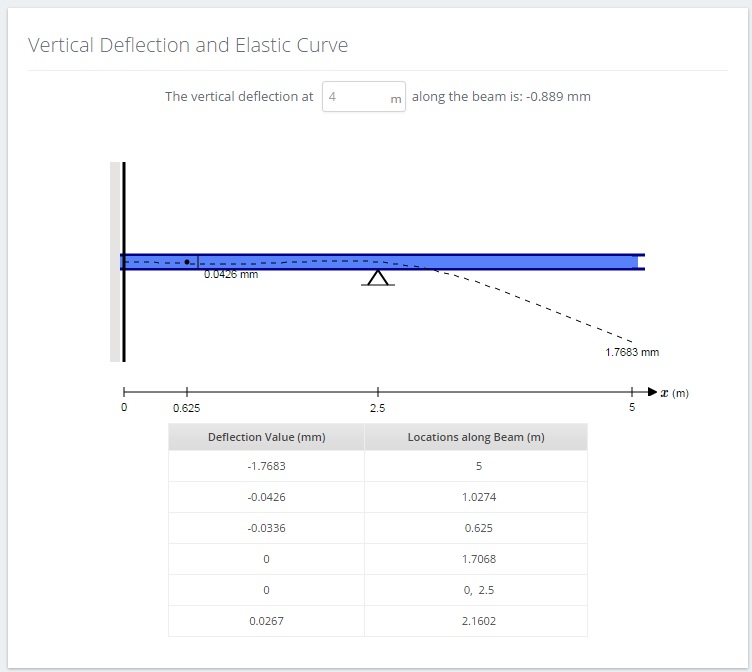
The vertical deflection and elastic curve of your model is presented with the results. In the middle is a diagram showing an elastic curve overlaid onto the original model with results shown at certain points.
Above the diagram, an input box is available to enter in a specific position along the beam to determine the vertical deflection at that point.
Below the diagram, a table presenting the deflection values at different locations along the beam is shown. The table is ordered from most negative (downward) to most positive (upward) vertical deflection.
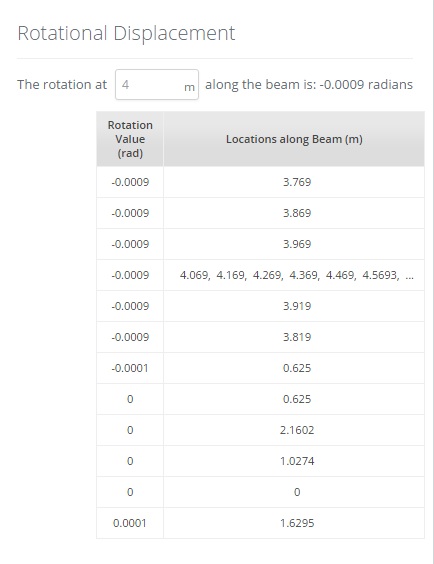
The rotational displacement results (in radians) at different locations along the beam is presented in a table. The table is ordered from most negative (clockwise) to most positive (counterclockwise). The angles are relative to the horizontal positive X axis.
Above the diagram, an input box is available to enter in a specific position along the beam to determine the rotation at that point.
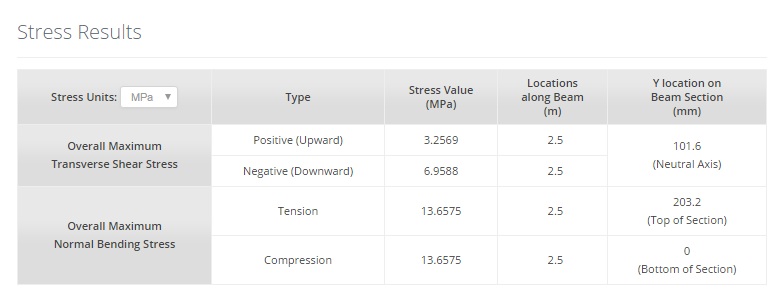
The Stress Results section will display the maximum transverse shear and normal bending stress values in a table. Their location along the beam (X Axis value), and location on the cross section (Y Axis value) is also shown. Note that the results are separated into maximum values for upward/downward and tension/compression values respectively. Transverse shear stress typically only has 1 value unless there is a shear force discontinuity at that point (see example below and check against the SFD).
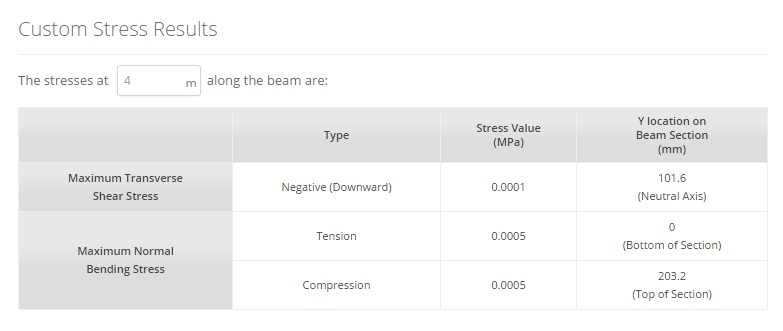
The Custom Stress Results section will display the maximum transverse shear and bending stress results at a specific location along the beam. Similar to the Stress Results section, the location on the cross section (Y Axis value) is also shown.